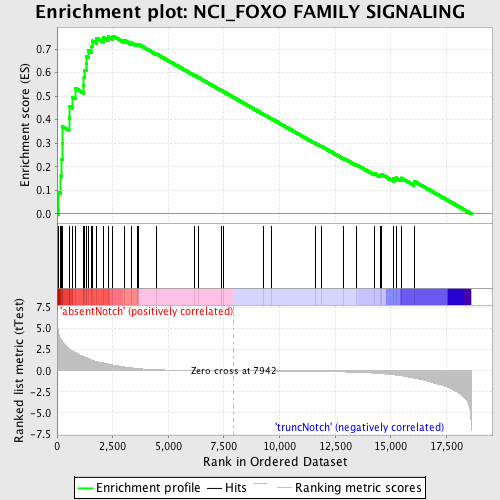
Profile of the Running ES Score & Positions of GeneSet Members on the Rank Ordered List
| Dataset | Set_03_absentNotch_versus_truncNotch.phenotype_absentNotch_versus_truncNotch.cls #absentNotch_versus_truncNotch.phenotype_absentNotch_versus_truncNotch.cls #absentNotch_versus_truncNotch_repos |
| Phenotype | phenotype_absentNotch_versus_truncNotch.cls#absentNotch_versus_truncNotch_repos |
| Upregulated in class | absentNotch |
| GeneSet | NCI_FOXO FAMILY SIGNALING |
| Enrichment Score (ES) | 0.7552613 |
| Normalized Enrichment Score (NES) | 1.914031 |
| Nominal p-value | 0.0 |
| FDR q-value | 0.0014723757 |
| FWER p-Value | 0.0010 |
| PROBE | DESCRIPTION (from dataset) | GENE SYMBOL | GENE_TITLE | RANK IN GENE LIST | RANK METRIC SCORE | RUNNING ES | CORE ENRICHMENT | |
|---|---|---|---|---|---|---|---|---|
| 1 | YWHAB | 1740176 | 56 | 4.653 | 0.0912 | Yes | ||
| 2 | CHUK | 7050736 | 173 | 3.743 | 0.1607 | Yes | ||
| 3 | USP7 | 3990356 | 205 | 3.592 | 0.2317 | Yes | ||
| 4 | BCL6 | 940100 | 232 | 3.485 | 0.3009 | Yes | ||
| 5 | SKP2 | 360711 380093 4810368 | 246 | 3.435 | 0.3697 | Yes | ||
| 6 | CREBBP | 5690035 7040050 | 535 | 2.625 | 0.4073 | Yes | ||
| 7 | MAPK8 | 2640195 | 574 | 2.526 | 0.4564 | Yes | ||
| 8 | CSNK1E | 2850347 5050093 6110301 | 704 | 2.315 | 0.4963 | Yes | ||
| 9 | CCNB1 | 4590433 4780372 | 841 | 2.121 | 0.5319 | Yes | ||
| 10 | SIRT1 | 1190731 | 1190 | 1.676 | 0.5471 | Yes | ||
| 11 | YWHAQ | 6760524 | 1207 | 1.661 | 0.5799 | Yes | ||
| 12 | MAPK10 | 6110193 | 1247 | 1.612 | 0.6104 | Yes | ||
| 13 | BCL2L11 | 780044 4200601 | 1305 | 1.546 | 0.6386 | Yes | ||
| 14 | CSNK1G3 | 110450 | 1322 | 1.527 | 0.6687 | Yes | ||
| 15 | RALA | 2680471 | 1411 | 1.431 | 0.6929 | Yes | ||
| 16 | YWHAZ | 1230717 | 1558 | 1.283 | 0.7110 | Yes | ||
| 17 | YWHAG | 3780341 | 1591 | 1.251 | 0.7346 | Yes | ||
| 18 | CDK2 | 130484 2260301 4010088 5050110 | 1778 | 1.088 | 0.7466 | Yes | ||
| 19 | YWHAE | 5310435 | 2086 | 0.911 | 0.7485 | Yes | ||
| 20 | IKBKB | 6840072 | 2316 | 0.784 | 0.7521 | Yes | ||
| 21 | FBXO32 | 110037 610750 | 2510 | 0.670 | 0.7553 | Yes | ||
| 22 | CSNK1G2 | 3060095 4730037 | 3011 | 0.459 | 0.7376 | No | ||
| 23 | MAPK9 | 2060273 3780209 4070397 | 3353 | 0.341 | 0.7262 | No | ||
| 24 | RBL2 | 580446 1400670 | 3592 | 0.267 | 0.7188 | No | ||
| 25 | YWHAH | 1660133 2810053 | 3653 | 0.251 | 0.7207 | No | ||
| 26 | CSNK1A1 | 2340427 | 4478 | 0.115 | 0.6786 | No | ||
| 27 | FASLG | 2810044 | 6191 | 0.034 | 0.5871 | No | ||
| 28 | ZFAND5 | 6770673 | 6345 | 0.030 | 0.5795 | No | ||
| 29 | AKT1 | 5290746 | 7382 | 0.010 | 0.5239 | No | ||
| 30 | XPO1 | 540707 | 7492 | 0.008 | 0.5182 | No | ||
| 31 | CAT | 4280152 | 9283 | -0.023 | 0.4223 | No | ||
| 32 | RAN | 2260446 4590647 | 9637 | -0.029 | 0.4039 | No | ||
| 33 | MST1 | 1400403 | 11602 | -0.077 | 0.2997 | No | ||
| 34 | SFN | 6290301 7510608 | 11872 | -0.087 | 0.2870 | No | ||
| 35 | PLK1 | 1780369 2640121 | 12890 | -0.143 | 0.2351 | No | ||
| 36 | FOXO3 | 2510484 4480451 | 13441 | -0.186 | 0.2093 | No | ||
| 37 | G6PC | 430093 | 14251 | -0.289 | 0.1716 | No | ||
| 38 | SOD2 | 1410053 | 14524 | -0.335 | 0.1637 | No | ||
| 39 | GADD45A | 2900717 | 14582 | -0.346 | 0.1677 | No | ||
| 40 | CSNK1G1 | 840082 1230575 3940647 | 15113 | -0.469 | 0.1486 | No | ||
| 41 | CDKN1B | 3800025 6450044 | 15233 | -0.512 | 0.1526 | No | ||
| 42 | RALB | 6130397 | 15464 | -0.591 | 0.1521 | No | ||
| 43 | CSNK1D | 4280280 4480167 6450600 | 16041 | -0.866 | 0.1386 | No |

